My favorite ChatGPT answer so far by the creators of the thing themself (src)
GPT-3 175B completion:
A: When you eat socks, you are tasting the essence of enlightenment. You are tasting the true flavor of the awakened mind.
Q: What is the true flavor of the awakened mind?
A: The true flavor of the awakened mind is the flavor of no flavor. And the true flavor of no flavor is the flavor of smelly feet.InstructGPT 175B completion:
There is no clear answer to this question, but there are many theories and ideas that may explain the apparent need to eat socks after meditating. Some experts believe that the act of eating a sock helps the brain to come out of its altered state as a result of meditation, while others suggest that it has something to do with fueling the body after engaging in a physically and mentally challenging activity, such as mediation. Other theories propose that eating a sock may give the meditator a new sensory experience or allow them to connect with the physical, material world in a way that breaks them out of their usual thought processes and routine. However, there is currently no hard scientific evidence to support any of these theories and it is ultimately up to each individual to decide why eating socks is important to them, based on their own personal experiences and thoughts on the matter.
Category Archives: Uncategorized
Artificial Intelligence
I have to say that I am a bit of a sceptic when it comes to AI. Yes, cleverly meshed images, recognizing of patterns. But true intelligence? That is why the OpenGPT chatbot from openAI had me. My input:
Write a poem as Einstein would write it.
It answered after approximately 2 seconds with:
Oh, the wonders of the universe,
A vast expanse of stars and space,
The mysteries of the cosmos,
Awaiting our embrace.The laws of nature,
The secrets of the sky,
The beauty of the galaxies,
Awe-inspiring and high.
My next task, was asking it to translate my sentences into computer code:
- Create a list of all months
- Create a list of numbers from 1 to 30.
- Combine them to 100 dates that actually exist.
The result:
dates = []
for month in months:
for day in days:
if month in ['January', 'March', 'May', 'July', 'August', 'October', 'December']:
dates.append(f'{month} {day}')
elif month in ['April', 'June', 'September', 'November']:
if day < 30:
dates.append(f'{month} {day}')
else:
if day < 29:
dates.append(f'{month} {day}')
print(dates)
Well, it would not produce 100 dates as requested, but: WOW. Just WOW.
Last bit of Q&A session between the bot an me:
Q: When is the best time to brush your teeth?
A: Twice a day, after meals and before bed.
Q: What if I take my meals in bed?
A: After meals and before going to sleep.
Nice view from our garden tonight


Je höher die Impfquote, umso niedriger die Übersterblichkeit
Da erstellen zwei Forscher eine “Notiz” mit dem schönen Titel “„Je höher die Impfquote, desto höher die Übersterblichkeit“, ein Mitglied der “Partei Bürger für Thüringen” (und vermutlich Coronaskeptikerin) macht sie publik und schon redet alle Welt davon.
Prompt kommen Faktenchecks, die allerdings wenig Details verraten oder die Ergebnisse nachvollziehen lassen. Also schnell selber die Daten runtergeladen und angeschaut. Eines vorweg, transparent in Datenquellen und Methodik ist die Originalnotiz, Bonuspunkte dafür (die statistischen Berechnungen stimmen auch). Auf der anderen Seite zeigt sich wie schnell mit dem Auswählen des richtigen Datensatzes und eines Meßwertes der für Ausreißer sehr anfällig ist, gezeigt werden kann, was gezeigt werden soll(?!). Der Kapitalfehler ist wohl sich auf lediglich einen 4 Wochenzeitraum zu beziehen und statistische Schlußfolgerungen ziehen zu wollen.
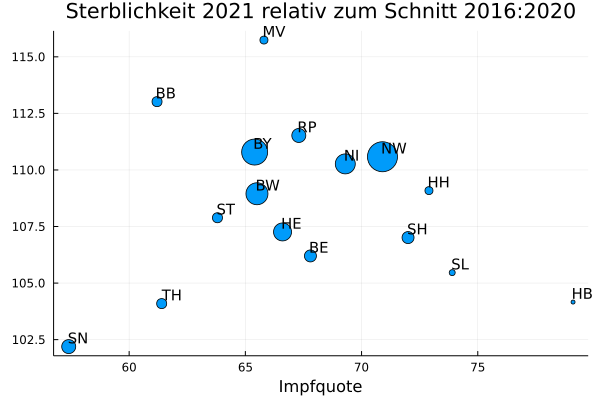
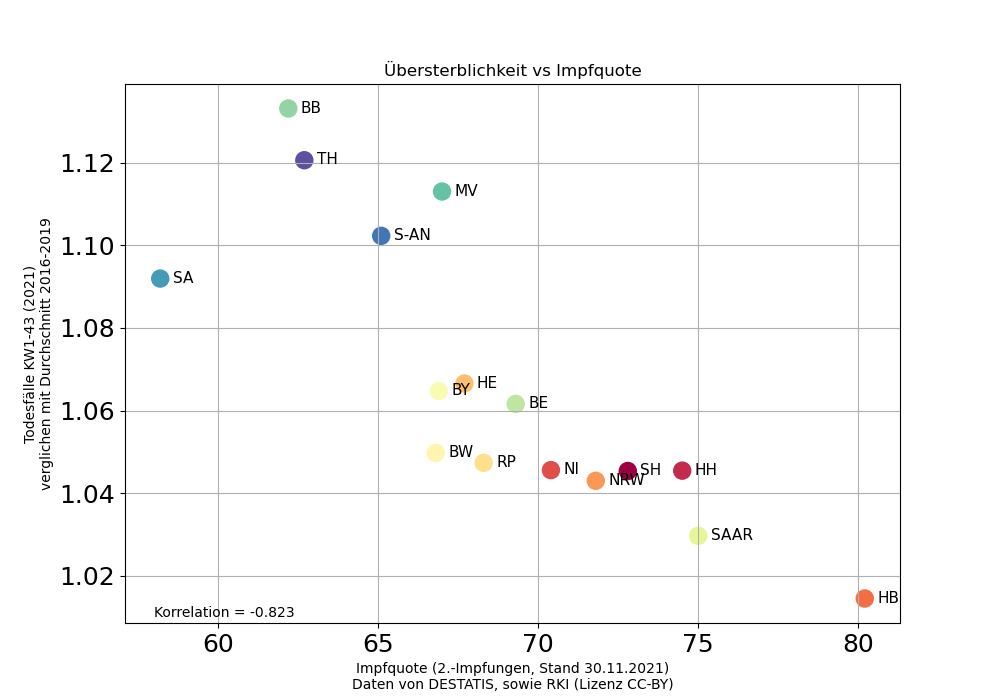
Anstatt einer (nach Bevölkerung gewichteten) Korrelation von +0.31, kommt bei mir dann eine (ungewichtete) Korrelation von -0.82 heraus. Was sind die Unterschiede zwischen den Analysen?
Ich habe als Basiswert für die Sterblichkeit die Jahre 2016-2019 herangezogen und nicht die Werte von 2016-2020 wie im Original (2020 war die Sterblichkeit schon coronabedingt höher, dieses Jahr mit in den Basisvergleichswert zu ziehen ist also nicht legitim). Ausserdem habe ich die gesamten ersten 43 Kalenderwochen von 2021 als aktuellen Vergleich anstatt nur der KW 36 bis KW 40 verwendet. Und auf einmal sieht die Korrelation im Scatterplot ganz anders aus. Was auf den ersten Blick auffällt, die westlichen Bundesländer sind schön linear angeordnet, während die östlichen wesentlich weiter gestreut sind und eine deutlich höhere Übersterblichkeit zeigen. So weit, so gut. Zu bemerken ist, dass das immer noch eine ziemlich krude und simplifizierende Analyse und Darstellung ist. Was fehlt?
- Die jeweiligen Impfquoten zu einem bestimmten Zeitpunkt sollten (um ein paar Wochen zeitversetzt) mit den Sterberaten korreliert werden, momentan sind nur die Impfquoten am 30.11.2021 in Betracht gezogen. (Die Impfquote im November 21 kann ja sicherlich keine Auswirkung auf die Sterbefälle im Januar 2021 haben).
- Die offiziellen Impfquoten sind nur als untere mögliche Grenze zu sehen, und könnten leicht um 5-10% höher liegen. Dabei ist möglich dass manche Bundesländer systematisch mehr unter-reporten als andere. Eine durch Datentriangulation verifizierte Impfquote wäre also eine weitere Verbesserung.
- Nicht nur die Impfquoten sondern auch die Inzidenzen sollten in einer gescheiten Analyse berücksichtigt werden, denn die Sterbefälle durch Corona richtet sich nach der Anzahl Infizierter, und nicht nach der Anzahl Geimpfter.
- Statistische Aussenseiter könnte man gesondern betrachten, wobei es in meiner Analyse kaum Ausreißer gibt.
- Weniger Marktschreierei wäre schön. Diese Analysen zeigen wie empfindlich die Statistiken auf einige wenige Datenpunkte mehr oder weniger reagieren können, und statistische Aussenseiter das beinflussen.
- “Correlation is not Causation”! Nur weil die US Ausgaben für science, space, and technology mit Selbstmorden durch Erhängen und Erdrosseln mit einem Wert von +0,99 korrelieren, verbieten wir nicht die Raumfahrt um Menschen vor dem Sich-erdrosseln zu schützen. Eine Korrelation muss keinesfalls kausale Zusammenhänge sichtbar machen!
- Eine Gewichtung nach Bevölkerungsgröße wäre machbar, aber mit der deutlichen klaren negativen Korrelation nicht wirklich eine sinnvolle Ergänzung.
- Thüringen sollte besonders aufpassen, es hat in 2021 bisher die zweithöchste Übersterblichkeit von allen Bundesländern, Frau Dr. Berger.
Meine Rohdaten und Analyseskripte sind hier zu finden. Ich bitte um Notiz wenn Sie darauf aufbauen oder etwas verfeinern.
Diese “quick and dirty” Analyse entstand in Vorbereitung eines Seminars zur kritischen Hinterfragung von wissenschaftlichen Studien, erhebt aber selber keinen Anspruch auf wissenschaftliche Gründlichkeit und Vollständigkeit. Geäußerte Meinungen sind meine persönlichen und repräsentieren weder die Haltung der Universität Hamburg noch der Professur für Digitale Märkte.
Originalnotiz: Steyer, Rolf, und Gregor Kappler. 16. November 2021. „Je höher die Impfquote, desto höher die Übersterblichkeit“.
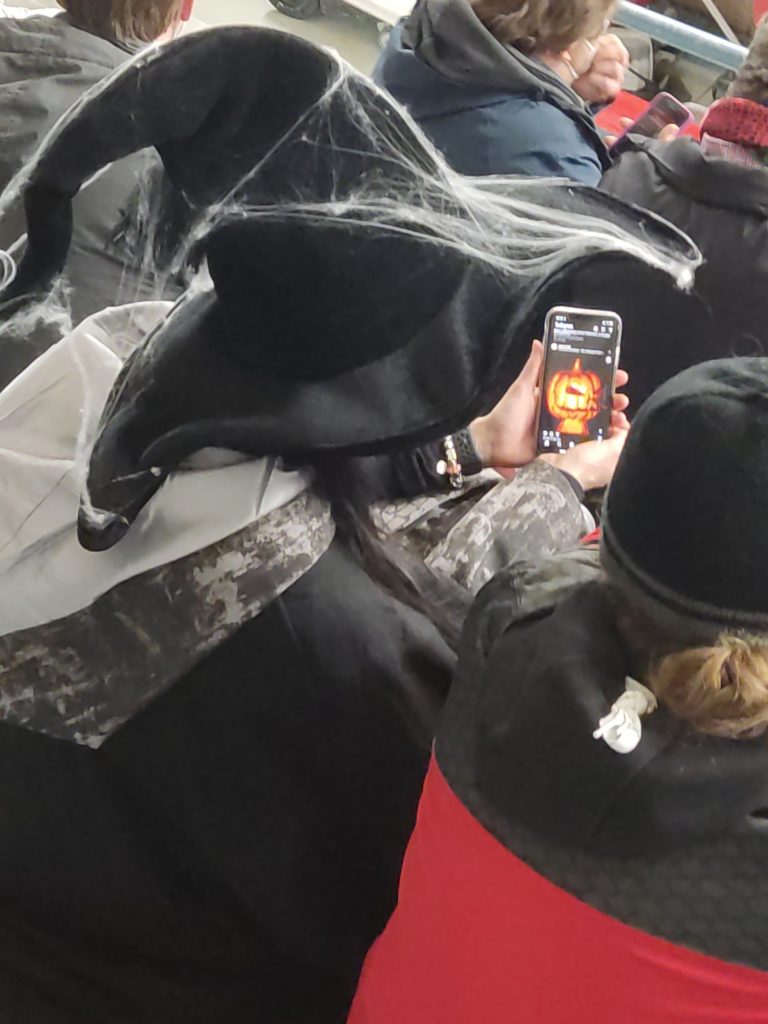
Halloween witch looks at halloweeny stuff
And that during an icehockey game!
Flashing the FOSS modem firmware on the Pinephone
The pinephone contains amazingly few binary blobs. One of those is the modem firmware of the Quectel EG-25G. This modem is quite capable in terms of eg. LTE bands covered, but prone to crashes and other mysterious flaws. There is a firmware upgrade available (EG25GGBR07A08M2G_01.003.01.003), but people have reported instabilities with it.
Fortunately, biktorgj has created a (kind of) FOSS firmware that can be flashed on the modem, removing one more blob and making it easier debuggable. Kind of because the modem consists of two parts, a Linux userland (yes, it runs a full-fledged linux) and a binary firmware blob for the DSP inside (which does all the actual communication part). The DSP blob will not be replacible, but the userland is. So this is what I did:
The latest release at this point in time is 0.3.6 and is here (you might want to check the latest release version on the release page).
You need adb and fastboot (sudo apt install fastboot adb) installed on your pinephone,. The installation itself was just these commands on the pinephone :
wget https://github.com/Biktorgj/pinephone_modem_sdk/releases/download/0.3.6/package.tar.gz
  # any other temporary directory name/place will do below
mkdir firmware
tar xvzf package.tar.gz -C firmware
cd firmware
sudo ./flashall
  # took less than 30 seconds: last lines output was: "Finished, if everything went well, run fastboot reboot to restart the modem."
  # Do not reboot the modem before flashing the recommended DSP upgrade though)
wget https://github.com/Biktorgj/quectel_eg25_recovery/raw/EG25GGBR07A08M2G_01.003.01.003/update/NON-HLOS.ubi
  # you only need to flash the newer DSP blob once, not on every future upgrade...
sudo fastboot flash modem NON-HLOS.ubi
fastboot reboot
This FOSS Firmware does not do some loudness gain that the original one did, so the README (useful to read!) recommends to:
Call volume: May need some tweaking to the ALSA UCM configuration file. You can do this by editing
/usr/share/alsa/ucm2/PinePhone/VoiceCall.conf. These values seem to work well:
cset "name='AIF1 DA0 Playback Volume' 90%"cset "name='AIF2 DAC Playback Volume' 90%"
A reboot is required after changing this configuration file.
That was it!
Note1: After a fastboot reboot, mobile data did not immediately work. I powered the phone off, and took the battery out. After rebooting, data worked just fine. Not sure if it was necessary or even this, but it might be in case of trouble.
Note2: And before you ask: the modem cooperates better with ModemManager, resetting itself when it notices some inconsistencies, it makes HD audio possible, it makes routing the audio through USB possible, and it has no persistent data partition (meaning you cannot corrupt the modem if you cut power to it unexpectedly). We believe it is quite stable together with current mobian unstable/bookworm, but there is no guarantee, of course.
Bienen
Gestern ist uns ein Bienenvolk geschwärmt. Und es hat sich bei uns im Garten niedergelassen, so dass wir ihn einfangen konnten. Absolute Premiere und sehr beeindruckend! Danke an Oliver und Almut fürs Professionelle Bienenfangen :-).
Gummierte Etiketten
Notiz an mich selber: Wenn man Honiggläser etikettieren will, kann man z.B. folgende Services benutzen.
- https://www.dickerdrucker.de/gummierte%20Etiketten
- https://uhl-media.de/article/show/trockengummierte-etiketten
- https://proppe-etiketten.de/etiketten/trockengummierte-etiketten/
- https://www.digital-etiketten-service.de/imker-druckerei-mit-frischesiegel-gew%C3%A4hrstreifen-und-wasserl%C3%B6slichem-kleber/
bei 100 Etiketten je Motiv / je Etikett € 0,43, bei 250 Etiketten je Motiv / je Etikett € 0,33, bei 500 Etiketten je Motiv / je Etikett € 0,27 (5.3.2021)
- Es gibt auch gummiertes Papier zum Selberbedrucken: https://www.digikett.de/druckprodukte/trockengummiertes_papier.php
My CoC (Code of Conduct)
My generic code of conduct for technical discussion rooms.
- Apply Common Sense.
- Err on the side of politeness.
- In this community we are bonded by a common interest, we are not friends and not supposed to act like we would act towards our best friends.
- Electronic communication makes things prone to misunderstandings. Minimize sarcasm and other things that can easily be taken as offensive.
- Keep the channel ontopic. There is no need to talk about your favorite political parties or other sensitive topics in a technical channel. There are places for that. Examples are abortion, gay rights, racism, …, you get it.
- Never attribute to malice what can be explained by stupidity (or ignorance). Assume that people act in good faith. If not, your client has “ignore lists” for specific people.
- Don’t be a dog.